How to Measure Customer Service Performance (2026 Guide)
Quick Answer
To measure customer service performance, track these six core metrics:
Metric What It Measures 2026 Benchmark CSAT Satisfaction after a single interaction 85%+ FCR Issues resolved without follow-up 75–80%+ FRT Speed of first reply Under 1 hr (email), Under 1 min (chat) NPS Overall loyalty and likelihood to recommend 38–49 (varies by industry) CES How easy it was to get help Lower = better ART Total time to fully resolve an issue ~32 minutes (best-in-class) Collect data through post-interaction surveys and a help desk or ticketing system. Set targets against industry benchmarks, review weekly, and act on what you find.
If you cannot measure it, you cannot improve it. That is the uncomfortable truth behind most customer service problems.
Most businesses know their support is not great. Response times feel slow, customers follow up more than once, and satisfaction scores sit somewhere in the middle. But without concrete measurement, “improving customer service” stays a vague intention rather than a specific plan.
This guide gives you the specific plan.
You will find every metric that matters, how to calculate each one, what benchmarks to compare against in 2025–2026, and a step-by-step process to build a measurement system that actually improves performance — not just tracks it.
Whether you are starting from scratch or trying to figure out why your current metrics are not moving, this is where to begin.
Table of Contents
Why This Matters More Than Ever
Poor customer service is not just a satisfaction problem. It is a revenue problem.
Businesses lose an estimated $75 billion annually due to bad customer service. And 91% of customer service leaders say expectations have increased year over year.
You can see exactly what happens to businesses that ignore this in our breakdown of the consequences of poor customer service.
On the other side, measurement-driven teams consistently outperform guessing:
- A 5% improvement in retention can increase profits by 25–95% (Bain & Company)
- Customer-obsessed organizations grow profits 49% faster and retain customers at 51% higher rates than peers (Forrester, 2024)
- Customers with high CSAT scores (4–5 out of 5) have 30% higher lifetime value than dissatisfied ones
Measurement is what connects your team’s daily work to these outcomes. Without it, effort does not compound — it just disappears.
The 8 Customer Service Performance Metrics That Actually Matter
Not every metric deserves your attention. These eight connect directly to retention, revenue, or cost. Everything else is noise.
1. Customer Satisfaction Score (CSAT)
What it measures: How satisfied a customer was with a specific interaction.
Formula:
CSAT = (Satisfied responses ÷ Total responses) × 100Count scores of 4–5 on a 5-point scale (or 8–10 on a 10-point scale) as satisfied.
How to collect it: Send a one-question survey within minutes of closing a ticket: “How satisfied were you with the support you received today?”
2026 benchmark: 85%+ is industry standard. Below 70% requires immediate attention.
Why it matters: CSAT is your fastest feedback signal. It catches agent performance issues and channel-specific problems before they compound.
For a deeper look at what drives satisfaction, see why customer satisfaction is important.
2. First Contact Resolution (FCR)
What it measures: The percentage of issues resolved on the first interaction, with no follow-up needed.
Formula:
FCR = (Issues resolved on first contact ÷ Total issues) × 1002026 benchmark: Industry standard 70–79%. World-class is 80%+. Below 65% is a problem that needs fixing now.
Why it matters: FCR is the single most powerful lever for both cost reduction and satisfaction improvement. Every repeat contact wastes agent time and frustrates the customer. A team that jumps from 65% to 75% FCR typically sees CSAT rise alongside it — because the two are directly linked.
3. First Response Time (FRT)
What it measures: How quickly your team sends the first reply after a customer submits a request.
Formula:
FRT = Total first response times ÷ Total tickets in period2026 benchmarks by channel:
| Channel | Acceptable | Best Practice |
|---|---|---|
| Live chat | Under 5 minutes | Under 1 minute |
| Under 24 hours | Under 1 hour | |
| Phone | Under 2 minutes on hold | Immediate |
| Social media | Under 4 hours | Under 1 hour |
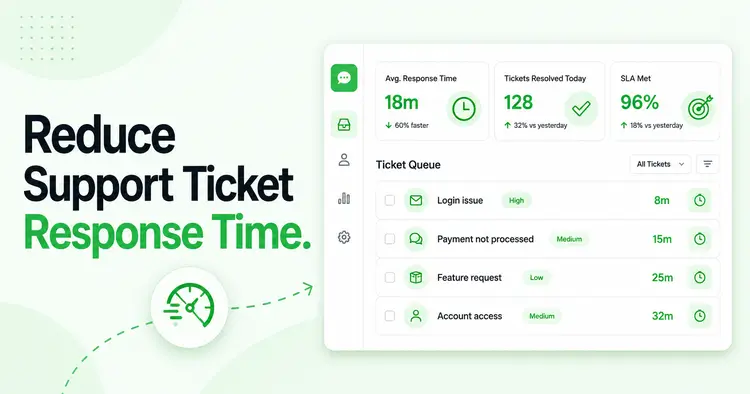
Why it matters: Slow first responses are the number one driver of customer complaints. Speed signals that you take the customer seriously.
For specific tactics to reduce this number, see our guide on how to reduce support ticket response time.
4. Net Promoter Score (NPS)
What it measures: How likely a customer is to recommend your business — a measure of overall loyalty, not just satisfaction with one interaction.
Formula:
NPS = % Promoters (score 9–10) − % Detractors (score 0–6)Ask: “On a scale of 0–10, how likely are you to recommend us to a friend or colleague?”
2025–2026 benchmarks: B2C average is 49, B2B average is 38. Forrester found NPS dropped in 20 out of 39 industry-country combinations in 2025, meaning most teams are losing ground to rising customer expectations.
Why it matters: A falling NPS is an early warning of churn — weeks before it shows in revenue. Unlike CSAT, it reflects the full customer relationship, not just one interaction.
5. Customer Effort Score (CES)
What it measures: How easy it was for a customer to get their issue resolved.
How to collect it: Ask immediately after a support interaction: “How easy was it to resolve your issue today?” on a 1–7 scale (1 = very difficult, 7 = very easy). Average all responses.
Why it matters: Gartner found that 96% of customers who have a high-effort interaction become disloyal. CES often predicts churn better than satisfaction scores alone. Low-effort experiences build loyalty more reliably than “wow” moments do.
6. Average Resolution Time (ART)
What it measures: Total time from ticket creation to full resolution.
Formula:
ART = Total resolution time across all tickets ÷ Total tickets resolved2025–2026 benchmark: High-performing teams average ~32 minutes. Teams without structured systems average 36+ hours.
Why it matters: ART tells you whether your team is actually solving problems, not just responding to them. Chronic high ART usually means agent knowledge gaps or broken escalation paths, not effort problems.
7. Individual Agent Performance Metrics
Team averages hide where the real problems are. These per-agent metrics identify who needs coaching and who is excelling:
| Metric | What It Tracks | Target |
|---|---|---|
| Tickets resolved per day | Individual throughput | Varies by channel/complexity |
| Agent CSAT score | Per-agent satisfaction rating | 80%+ |
| Agent FCR rate | Per-agent first-touch resolution | 75%+ |
| Average Handle Time (AHT) | Time spent per interaction | 4–7 min (phone); 5–10 min (chat) |
| SLA compliance rate | % tickets resolved within SLA | 90%+ |
| Ticket reopen rate | % closed tickets reopened by customer | Under 5% |
Critical rule: Never evaluate agents on speed alone. An agent closing tickets fast with a 55% CSAT is creating problems, not solving them. Always pair throughput metrics with quality metrics.
For practical ways to keep individual agents motivated and performing, see how to motivate your customer service team.
8. Business Impact Metrics
These connect your support team to the wider business — and make the case to leadership:
- Customer Retention Rate — % of customers who stay over a given period. Target: 85–90%+. See our guide on best customer retention strategies for what to do with this data.
- Churn Rate — % who leave. Average SaaS churn in 2025: ~4.1% annually (ProProfs KB, 2026). Knowing the top causes of customer churn helps you address problems upstream.
- Cost Per Contact — Cost of handling each interaction. Use it to measure the real ROI of automation.
- Customer Lifetime Value (CLV) — Total revenue per customer over their full relationship with you.
How to Measure Customer Service Performance
Step 1 — Get the Right Infrastructure
You cannot measure reliably without the right tools. At minimum:
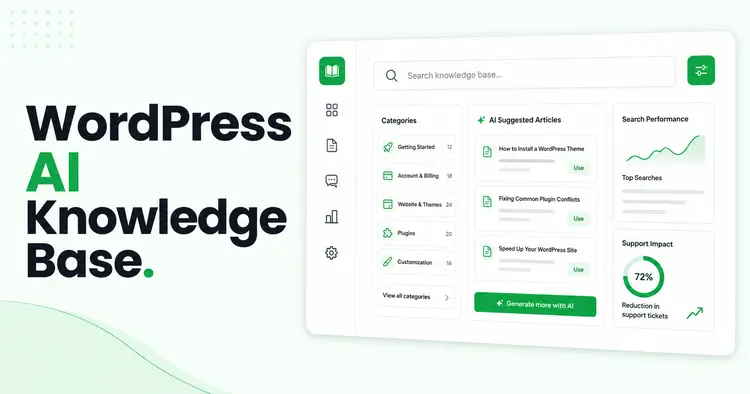
- A help desk or ticketing system that automatically logs FRT, ART, ticket volume, and per-agent activity. Running support purely on email gives you no usable data. A system like Support Genix captures all core metrics automatically and surfaces them in dashboards — no manual tracking needed.
- Post-interaction surveys are triggered automatically when a ticket closes. One to two questions maximum. Longer surveys get abandoned.
- NPS surveys are deployed at lifecycle milestones: after onboarding, at renewal, and after significant interactions.
Step 2 — Pick the Right Metrics for Your Current Problem
Do not try to fix everything simultaneously. Match your metrics to your actual problem:
| What is going wrong | Focus here first |
|---|---|
| Customers keep following up | FCR + Ticket Reopen Rate |
| Responses feel too slow | FRT + ART |
| Satisfaction scores are low | CSAT + CES |
| Customers are leaving | NPS + Churn Rate |
| Performance varies by agent | Agent CSAT + AHT + FCR per agent |
Step 3 — Establish Your Baseline Before Setting Targets
Pull 90 days of data. Calculate your current average for each chosen metric. Compare it to the benchmarks in this guide. The gap is your improvement opportunity.
Set a realistic 90-day improvement target — not a leap to world-class in one quarter. Trying to jump from 60% FCR to 80% FCR in 90 days almost always fails and demoralizes your team.
Step 4 — Build a Consistent Review Cadence
| Frequency | What to review |
|---|---|
| Daily | Live queue: open tickets, wait times, agent availability |
| Weekly | FRT, FCR, CSAT trends — flag anything moving the wrong direction |
| Monthly | Full KPI analysis vs. prior month and targets |
| Quarterly | Connect service metrics to business outcomes: revenue, churn, CLV |
Step 5 — Act on What the Data Tells You
When a metric drops, run root cause analysis before jumping to solutions:
- FCR dropping? → Check knowledge gaps, routing accuracy, or unnecessary escalations
- FRT rising? → Check ticket volume trends, staffing, automation coverage
- CSAT declining? → Review low-rated interactions for patterns in behavior or process
- NPS falling? → Look beyond support — billing friction, product issues, or onboarding failures often drive NPS more than support quality does
For a structured approach to finding and fixing gaps, see our guide on how to improve your customer service strategy.
Customer Service Performance Benchmarks by Channel (2025–2026)
Phone Support
- Average Handle Time: 4–7 minutes (Lorikeet, 2026)
- FCR: 75–80%
- CSAT: 80–85%
Email Support
- First Response Time: Under 1 hour (best); under 24 hours (acceptable)
- FCR: 70–75%
- CSAT: 75–85%. Email achieves 82% satisfaction rates when responded to promptly
Live Chat
- First Response Time: Under 1 minute
- Handle Time: 5–10 minutes
- FCR: 60–70%
- CSAT: 85–90%
Self-Service and AI
- AI now handles ~85% of routine interactions without human involvement
- Well-deployed chatbots reduce ticket volume by 40–60%
- Target self-service resolution rate: 30–50%
How AI Is Changing What “Good Performance” Looks Like
AI has shifted the baseline for what a well-run support team looks like. If you are not accounting for this, your benchmarks are outdated.
Key numbers from 2025–2026:
- AI for customer service is projected to grow from $12.06B in 2024 to $47.82B by 2030
- Organizations using AI see a 25% reduction in operational costs.
- AI helps agents handle 13.8% more inquiries per hour on average.
- Gartner projects 80% of contact centers will use AI for routing or coaching by end of 2026.
Two things to change in your measurement if you use AI:
- Track human and AI tickets separately. If your chatbot handles 40% of tickets, your human team’s FCR and ART will look different than teams without AI. Benchmark them independently so you see real performance for each.
- Add Containment Rate. This measures the % of queries fully resolved by self-service or AI without human escalation. High containment + high CSAT = working well. High containment + low CSAT = your automation is deflecting, not resolving. That distinction matters.
How to Improve Customer Service Performance: The Highest-Impact Actions
Fix Knowledge Gaps First
The most common cause of low FCR is that agents cannot find the answer during a live interaction. Build a centralized knowledge base your team can search in real time. Update it monthly based on trending ticket categories. When agents find solutions in under 30 seconds, FCR improves immediately.
Use SLAs to Create Accountability
Define response and resolution commitments by channel and ticket priority. Make them visible to agents. SLA compliance creates team accountability and sets clear expectations for customers.
See our guide on how to create a Service Level Agreement for a practical framework.
Coach on Agent Data, Not Team Averages
Review per-agent CSAT, FCR, and AHT weekly. When an agent’s score drops, review their recent interactions and identify the specific behavior to address. Targeted coaching from real interaction data is significantly more effective than generic training sessions.
Build a Feedback System That Closes the Loop
67% of customers will share feedback if they believe it will lead to improvements. Collect consistently through post-interaction surveys, then tell customers when you act on what they said. See our guide on different types of customer feedback to make sure you are capturing signals from the right channels.
For a full measurement approach to satisfaction, specifically, see how to measure customer satisfaction.
Go Omnichannel
Companies offering multi-channel support achieve 91% higher customer satisfaction rates. Customers should never need to repeat themselves when switching channels. A ticketing system that consolidates email, chat, and social into one view prevents this and improves both CSAT and CES simultaneously.
Set Individual Performance Goals
Customer service measurement only works when it connects to individual goals, not just team targets. See our guide on customer satisfaction objectives for a framework to build individual agent targets from the top-level metrics.
Best Practices That Separate Good Teams from Great Ones
- Measure outcomes, not activity. Ticket volume tells you how busy the team is. FCR tells you whether they are solving problems. Focus on outcome metrics.
- Contextualize before concluding. A spike in ART during a product launch is not the same problem as chronic high ART. Segment data by time period, channel, and issue type before acting.
- Avoid metric gaming. If CSAT is the only performance measure, agents learn to ask for good ratings rather than earn them. Use a balanced set of metrics plus a qualitative review of actual interactions.
- Share results transparently. Teams that see their own data weekly take more initiative than those who only hear numbers from management. Transparency drives ownership.
- Connect metrics to money. Show your team and leadership how a 5-point FCR improvement reduces support costs, or how a CSAT increase correlates with retention. When people see the business impact, measurement becomes a tool rather than oversight.
Tools You Need to Measure Customer Service Performance
- Help Desk / Ticketing System — The foundation. Tracks FRT, ART, FCR, SLA compliance, and agent performance automatically. Support Genix is purpose-built for WordPress businesses, with real-time reporting dashboards and integrations for WooCommerce, Slack, WhatsApp, and FluentCRM. No manual tracking required.
- Post-Interaction Surveys — Automate CSAT and CES collection after every ticket closes.
- CRM Platform — Provides customer history so agents can personalize responses and spot repeat issues.
- AI / Chatbot Tools — Handle routine queries 24/7, improving FRT and freeing agents for complex work.
- Analytics Dashboard — Surface KPI trends by agent, channel, and time period in one view.
Support Genix
WordPress Support Ticket Plugin
Take Your Customer Support to The Next Level and Boost Customer Satisfaction Rates
Frequently Asked Questions
What are customer service performance metrics?
Customer service performance metrics are specific, measurable numbers that show how well your support team is serving customers. The core ones are CSAT (satisfaction), FCR (resolution quality), FRT (response speed), NPS (loyalty), CES (ease of getting help), and ART (total resolution time).
Together, they give you a complete picture of both the customer experience and operational efficiency.
How do you measure good customer service?
Good customer service is measured by combining outcome metrics and experience metrics. Outcome metrics — such as FCR and ART — indicate whether problems are being solved. Experience metrics — like CSAT, NPS, and CES — tell you how customers felt about it. You need both. A team that resolves tickets fast but scores 60% CSAT is not delivering good customer service.
What is a good CSAT score?
An industry benchmark of 85% or higher is considered strong in 2025–2026. Scores above 90% are excellent. Below 70% indicates a significant problem. Always track CSAT per agent and per channel — team-wide averages hide where the real issues are.
What is a good First Contact Resolution rate?
The industry standard is 70–79%. World-class performance is 80% or higher. Below 65% is a clear signal of knowledge gaps, poor ticket routing, or broken escalation processes that need fixing before other improvements will stick.
How do you measure customer service performance for individual agents?
Use a combination of output metrics — tickets resolved, average handle time, SLA compliance rate — and quality metrics — per-agent CSAT, per-agent FCR, ticket reopen rate, and QA scores from reviewed interactions. Never evaluate agents on speed alone. It creates incentives to close tickets quickly rather than resolve them properly.
How do you measure customer service efficiency?
Efficiency is measured primarily through FRT (how fast you respond), ART (how fast you fully resolve), AHT (how long each interaction takes), Cost Per Contact (cost per ticket), and FCR (how often issues are resolved without repeat contacts). Together, these show whether your team is working effectively, not just working hard.
What are customer service benchmarks?
Customer service benchmarks are industry-standard performance targets used to evaluate whether your metrics are competitive. Key 2025–2026 benchmarks: CSAT 85%+, FCR 75–80%+, FRT under 1 hour for email and under 1 minute for chat, NPS 38–49 depending on industry, ART approximately 32 minutes for high-performing teams.
How often should you review customer service performance metrics?
Review live queue metrics daily. Track FRT, FCR, and CSAT trends weekly. Run a full KPI analysis monthly. Connect service metrics to business outcomes — revenue, churn, CLV — quarterly and present to leadership.
Final Words
Measuring customer service performance is not about surveillance. It is about clarity.
Without measurement, you are making decisions based on gut feel and anecdotes. With it, you know exactly where value is leaking, which agents need support, and what to fix next.
The process is straightforward: pick the right metrics for your current problem, set up the infrastructure to capture data automatically, review consistently, and act on what you find. Most teams that struggle with customer service performance are not failing at execution — they are failing at measurement. They work hard without knowing whether that work is pointed in the right direction.
Start with CSAT and FCR. Get those two tracking reliably. Then add FRT and agent-level metrics. Build from there.
The teams that consistently outperform on customer service are not the ones with the largest budgets. They are the ones that take measurement seriously, share data openly with their team, and make small, consistent improvements over time.
That is a system any team can build — starting today.