Measuring Customer Support ROI: Beyond Response Time

Most support teams know their average response time down to the minute. They track it, report it, optimize for it — and then wonder why their customer churn hasn’t moved.
Here’s the problem: response time measures speed, not value. And Customer Support ROI isn’t built on speed alone.
If you want to know whether your support team is actually contributing to revenue — retaining customers, reducing churn, and lowering operational costs — you need a broader measurement framework. This guide walks you through exactly that.
Quick Takeaway: Customer Support ROI measures the financial return your support operations generate compared to what they cost. To measure it accurately, go beyond response time and track First Contact Resolution (FCR), CSAT, Customer Effort Score (CES), Customer Lifetime Value (CLV), churn rate, and cost per ticket. Together, these metrics turn support from a cost center into a measurable business driver.
Table of Contents
Why Response Time Alone Misleads You

Response time is easy to measure — which is exactly why it gets so much attention. But it only tells you how fast your team replies, not whether they solved the problem, kept the customer, or delivered any business value.
Consider a WooCommerce store that hits a one-hour first-reply SLA every single day. Tickets close fast. Numbers look great on the dashboard. But CSAT scores are flat. Repeat contacts on the same issues keep rising. Customers still churn at the same rate.
Speed without resolution isn’t service — it’s theater.
Research shows that for every 1% increase in First Contact Resolution (FCR), Customer Satisfaction Score (CSAT) increases by a corresponding 1%. Response time has no such direct relationship with satisfaction or revenue.
If you want to reduce response time and improve outcomes, you need both speed and resolution quality working together — not speed alone.
The Customer Support ROI Formula
Before diving into individual metrics, it helps to understand what you’re actually calculating.
Customer Support ROI = (Customer Support Benefits – Customer Support Costs) ÷ Customer Support Costs × 100
If your support team generates $150,000 in retained revenue and costs $100,000 to run, your ROI is 50% — meaning every $1 spent returns $1.50 in value.
What counts as costs?
- Agent salaries and benefits
- Helpdesk and ticketing software
- Training and onboarding
- Overhead and workspace
What counts as benefits?
- Revenue retained from customers who would have churned
- Upsells and renewals influenced by support interactions
- Ticket deflection savings from self-service and automation
- Referrals and organic advocacy driven by great experiences
Most teams only track costs. The metrics below are designed to fix that — by putting real numbers behind the benefit side of the equation.
The 6 Metrics That Actually Measure Customer Support ROI
1. First Contact Resolution (FCR)
What it is: The percentage of customer issues fully resolved in a single interaction — no follow-ups, no callbacks, no repeat tickets.
Formula:
FCR Rate = (Issues resolved on first contact ÷ Total issues) × 100
Industry benchmarks: 70%–75% is average; 80%+ is strong; below 70% is a warning sign.
Why it matters for ROI: Unresolved first contacts create repeat tickets, which inflate your cost per interaction and erode satisfaction. Every unresolved ticket costs your team twice — once on the first contact and again on the follow-up. Improving FCR directly reduces operational costs and improves retention.
WooCommerce example: A store receiving 500 tickets per month with a 65% FCR rate handles roughly 175 repeat contacts for the same issues. Lifting FCR to 80% eliminates around 75 of those repeat contacts every month — that’s real cost saved at scale.
You can read more about how to measure customer service performance including FCR tracking methods in our dedicated guide.
2. Customer Satisfaction Score (CSAT)
What it is: A post-interaction survey score (typically 1–5 or 1–10) measuring how satisfied a customer was with a specific support interaction.
Formula:
CSAT % = (Number of satisfied responses ÷ Total responses) × 100
Why it matters for ROI: Customers who rate their experience as excellent spend significantly more than those who had a poor experience — and they stay longer. CSAT isn’t just a feel-good metric. It’s a leading indicator of renewal, upsell potential, and referral behavior.
Practical note: Don’t just report the score — segment it. Which ticket categories generate low CSAT? Which agents consistently score high? Where are the patterns? That’s where your ROI improvement opportunities live.
3. Customer Effort Score (CES)
What it is: CES measures how easy or difficult it was for a customer to get their issue resolved. It’s typically rated on a 1–7 scale, where 7 = “Very Easy.”
Formula:
CES = Average of all CES survey responses across a defined period
Why it matters for ROI: CES is one of the strongest predictors of customer loyalty. Customers who experience high friction during support interactions are significantly more likely to churn — even if the issue was eventually resolved. The resentment comes from the effort, not just the problem.
For WooCommerce stores, CES is especially critical during post-purchase and refund scenarios. If customers have to jump through hoops to get an order issue resolved, they don’t come back — and they often don’t leave a complaint either. They just leave.
4. Churn Rate (and Churn Prevention Value)
What it is: The percentage of customers who stop buying from you in a given period.
Formula:
Churn Rate = (Customers lost during a period ÷ Customers at the start of the period) × 100
Why it matters for ROI: A 5% increase in customer retention can boost profits by 25% to 95%. Support interactions are one of the most direct levers you have on churn — because a customer reaching out with a problem is already at a decision point.
To connect churn to Customer Support ROI, segment your churn data by support experience. Compare the churn rate of customers who had unresolved tickets versus those who had fast, complete resolutions.
The difference in churn rate × average customer value = your churn prevention revenue. That’s a direct benefit line in your ROI calculation.
5. Customer Lifetime Value (CLV)
What it is: The total revenue a business expects to earn from a single customer over the entire relationship.
Formula:
CLV = (Average Revenue Per Customer × Customer Lifespan) − Total Costs to Serve
Why it matters for ROI: For e-commerce businesses, average CLV ranges between $100 and $300. But support quality acts as a multiplier. Customers who receive great service spend more, stay longer, and refer others. According to Zendesk, 86% of consumers say fast, accurate resolutions influence whether they buy again.
Compare CLV across customer segments based on their support history. Customers who had at least one resolved support interaction typically show higher CLV than those who never contacted support — because resolved issues build trust rather than erode it.
6. Cost Per Ticket
What it is: The average cost to handle a single support ticket, including agent time, tooling, and overhead.
Formula:
Cost Per Ticket = Total Support Operating Costs ÷ Total Tickets Resolved
Industry benchmarks (2025–2026):
- Retail and e-commerce: $2.70–$5.60 per ticket
- SaaS/software: $18–$35
- B2B enterprise: $30–$60
Why it matters for ROI: Cost per ticket is your efficiency baseline. Improve FCR, introduce automation, or build a self-service knowledge base — and your cost per ticket drops, directly improving support margin. Support automation typically achieves a 25–40% reduction in agent workload. Every customer who finds an answer independently saves your team approximately 30 minutes of work.
Support Genix
WordPress Support Ticket Plugin
Take Your Customer Support to The Next Level and Boost Customer Satisfaction Rates
Connecting Metrics to Revenue: A 4-Step Framework
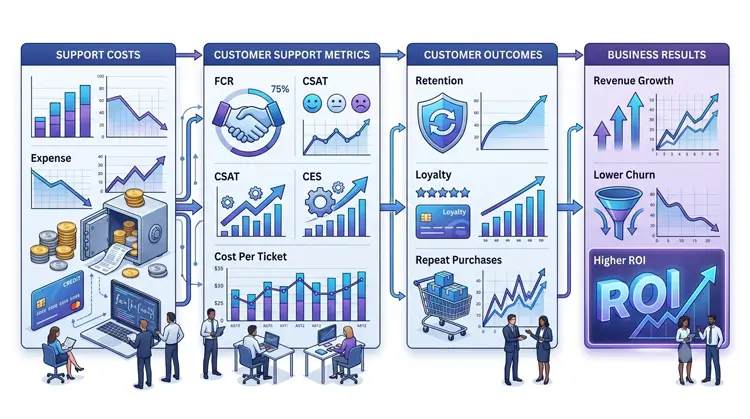
Measuring these six metrics in isolation isn’t enough. The real insight comes from connecting them to financial outcomes.
- Step 1 — Establish your cost baseline: Calculate your total monthly support cost (salaries + tools + overhead) and divide by ticket volume to get cost per ticket.
- Step 2 — Quantify retention benefits: Identify your monthly churn rate. Segment churned customers by those who had unresolved support issues (pull from your ticketing system). Multiply the number by average CLV to get your churn-linked revenue risk.
- Step 3 — Apply the ROI formula:
Benefits = retained revenue + upsells influenced by support + ticket deflection savings.
Costs = everything in Step 1.
Plug into: (Benefits – Costs) ÷ Costs × 100. - Step 4 — Track quarter-over-quarter: A one-time snapshot only tells you how support performed then. Comparing quarters shows whether improvements in FCR, CSAT, or CES are translating into measurable financial gains — and whether your tools and investments are working.
A Practical WooCommerce Example
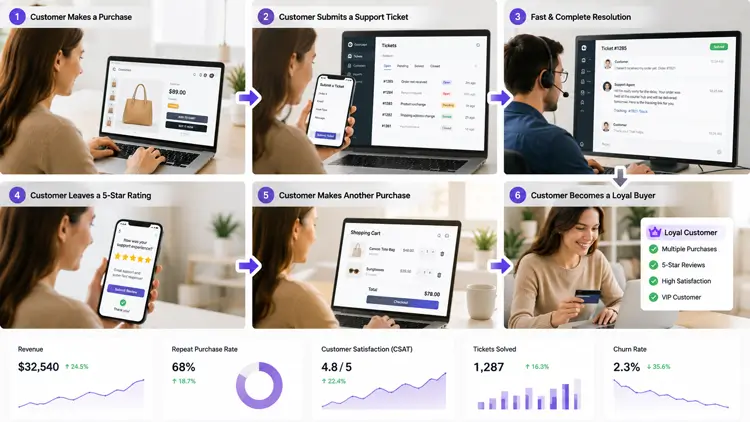
Here’s what Customer Support ROI measurement looks like for a mid-sized WooCommerce store:
- Monthly tickets: 800
- Current FCR: 68%
- Average CLV: $220
- Monthly churn: 4%
- Cost per ticket: $4.50
The team identifies that 30% of churned customers had at least one unresolved support ticket in their final 30 days. At a 4% monthly churn rate on 3,000 active customers, that’s 120 lost customers — 36 of whom had unresolved support issues. At $220 CLV each, that’s roughly $7,920/month in preventable churn revenue.
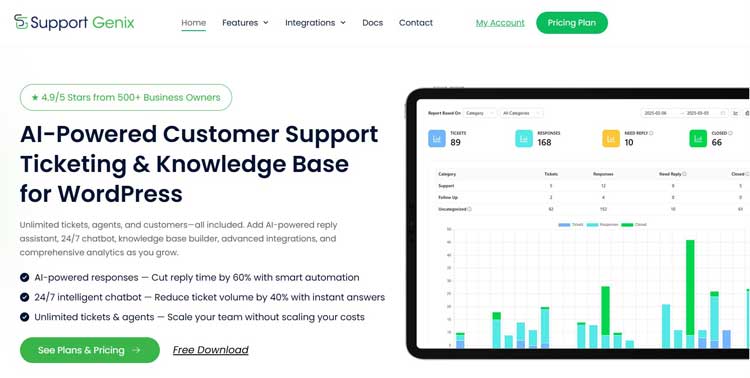
By implementing a structured ticketing system like Support Genix, improving knowledge base coverage (which can deflect 50%+ of tickets before they’re created), and improving routing and saved replies to lift FCR toward 80%, the store reduces repeat contacts, lowers cost per ticket, and cuts churn-linked revenue loss — without hiring a single additional agent.
That’s measurable Customer Support ROI.
NPS: The Long-Game ROI Metric
Net Promoter Score (NPS) measures how likely customers are to recommend your brand to others. It’s not a real-time operational metric, but it’s one of the strongest predictive indicators for long-term revenue growth.
Research shows that a 10+ point increase in NPS score correlates with a 3.2% increase in upsell revenue. Companies with higher NPS consistently show higher CLV — because loyal, vocal customers generate compounding revenue through referrals and repeat purchases.
For support teams, NPS tied to post-resolution surveys is particularly powerful. It shows whether individual interactions are building or destroying the long-term customer relationship — beyond what CSAT captures in the short term.
Common Mistakes When Measuring Support ROI
- Tracking speed without resolution quality. Fast replies that don’t solve problems create faster frustration — not loyalty.
- Measuring CSAT in isolation. CSAT tells you satisfaction in the moment. Pair it with CES and churn rate to understand whether satisfaction actually drives retention.
- Ignoring the long tail. The ROI isn’t in the ticket you closed. It’s in the customer who came back three months later for another purchase.
- Siloing support data from financial data. Your helpdesk and CRM need to share data. Without connecting ticket outcomes to customer purchase behavior, you’re guessing at ROI rather than calculating it.
- Measuring once instead of continuously. Customer Support ROI changes as your business grows. Track it quarterly — not annually — to catch trends and course-correct early.
Your Support ROI Dashboard: What to Track
A practical support ROI dashboard for a WordPress or WooCommerce operation should include:
| Metric | Tracking Frequency | Target Benchmark |
|---|---|---|
| FCR Rate | Weekly | 75–80%+ |
| CSAT Score | Monthly | 85%+ |
| Customer Effort Score (CES) | Monthly | 5.5+ / 7 |
| Churn Rate (segmented by support) | Monthly | Trending down |
| CLV by support cohort | Quarterly | Higher than non-contact cohort |
| Cost Per Ticket | Weekly | Trending down |
| NPS | Quarterly | Industry-relative improvement |
Tools like Support Genix give WordPress and WooCommerce teams a centralized ticketing platform that captures the interaction data needed to calculate and track these metrics — without the overhead of enterprise-grade CRM systems.
Frequently Asked Questions
What is Customer Support ROI and how do I calculate it?
Customer Support ROI measures the financial return your support operations generate relative to what they cost.
The formula is: (Benefits – Costs) ÷ Costs × 100.
Benefits include retained customer revenue, upsells influenced by support, and ticket deflection savings. Costs include agent salaries, tooling, training, and overhead.
Why is response time not enough to measure Customer Support ROI?
Response time measures speed — not value. A team can reply instantly but still fail to resolve the issue, drive repeat contacts, or cause customers to churn. Metrics like FCR, CSAT, and churn rate connect support activity to actual revenue outcomes, which response time alone cannot show.
What is a good First Contact Resolution (FCR) rate?
Industry averages sit between 70%–75%. A rate of 80%+ is considered strong. Below 70% signals a structural problem — whether in agent training, routing, or knowledge base quality. For every 1% increase in FCR, CSAT increases by approximately 1%.
How does customer support reduce churn?
Support interactions are often the last touchpoint before a customer decides to leave. Customers with unresolved issues churn at significantly higher rates than those with fast, complete resolutions.
Connecting churn data to ticket outcomes lets you calculate how much revenue support is saving or losing — and where to invest for maximum impact.
How can WooCommerce store owners measure Customer Support ROI?
Connect your ticketing data to your WooCommerce customer records. Track which customers contacted support, whether their issues were resolved on the first contact, and their purchase behavior afterward.
Compare CLV and retention rates between customers with resolved tickets and those who churned after unresolved contacts. The difference reveals your support’s direct contribution to revenue.
What is Customer Effort Score (CES) and why does it matter?
CES measures how easy or difficult it was for a customer to get their issue resolved, rated on a 1–7 scale. It’s one of the strongest predictors of customer loyalty. High-effort support experiences drive churn even when the issue is eventually resolved — because customers resent the friction, not just the problem.
How often should I review support ROI metrics?
Review cost per ticket and FCR weekly. CSAT and CES monthly. Churn segmented by support experience and CLV by customer cohort quarterly. NPS quarterly. This cadence gives you enough data to spot trends without reacting to daily noise.
Conclusion
Response time will always matter. But it’s a starting point, not a success metric.
True Customer Support ROI lives in the metrics that connect support activity to business outcomes: how often issues get fully resolved, how easy the experience feels, how long customers stay, and how much they spend over time.
Track FCR, CSAT, CES, churn rate, CLV, and cost per ticket — connect them to your financial data — and you’ll have a clear, defensible picture of what your support team is actually worth.
For WooCommerce and WordPress store owners, this isn’t just a reporting exercise. It’s a growth strategy. Every improvement in resolution quality, every friction point you remove, and every churned cstomer you retain translates directly into revenue — revenue you can measure, report, and build on.
Start with one metric you don’t currently track. Build from there.